Why are the Virologists Doing This? Machine Learning Edition
A data-driven look at scientists' motives
In counterintelligence, there’s an aphorism that the motives of people who betray their country or whatever they have loyalty to aren’t really that complicated. This reality is captured by the mnemonic “MICE”: Money, Ideology, Coercion, Ego. Since in this poast we’re going to be talking about scientists, at least two of those will come into play. Potentially three.
In light of some of the last months’ developments—primary intelligence agencies both in the US and Germany coming to the conclusion that the COVID-19 pandemic probably had a research related origin and yesterday’s unusually off-message NYT op-ed about scientists’ complicity in deceiving the public—it seems a bit like the dawn is breaking. There’s been a five year discussion about what’s going on with the western scientists who have looked at this issue. They’re publishing weak papers on COVID origins again! They’re publishing fraudulent papers on COVID origins! More raccoon dogs! Why are they doing this? We are not going to get a chance to read something like the Proximal Origins private slack communications again like when these were subpoenaed by congress, so can the reasons some of these virologists have behaved so badly be deduced from pubic information?
I had this idea to use different types of professional information about these academics and a bit of data analysis to build a machine learning model capable of discerning a well-known rogue’s gallery of virologists from those who’ve kept their heads down and stayed mum on this subject. If it’s done right, the model can then be examined to see why it made the prediction it did about a particular scientist in terms of the variables it was trained on. For those uninitiated in machine learning, this capability is a fairly mature subject called model interpretability, and we’re going to turn it on the central question the title of this poast asks.
Data
I used a variety of different tools to assemble a dataset of 243 living virologists or epidemiologists: openalex, wikipedia, Deep Research, meticulous and time-consuming manual munging. Sticking with the MICE framework above, the data elements assembled are as follows
Money
Scientists’ main funding organizations, to the extent that can be deduced from public information. I typically was able to get one or two funding agencies for each scientist. There aren’t as many unique organizations as one might think that fund this research even in an international group like we’re looking at. I used a lot manual internet elbow grease and Deep Research for this part.
Scientists’ funding diversification. Critics have claimed scientists who have fewer funding options might be more liable to capture by whoever funds them. I don’t think anyone has looked at this claim carefully.
Ideology
Scientists’ organizational affiliations. Is where a virologist works related to what they publish or how they behave? Do certain academic institutions breed certain attitudes? Can an academic be captured not by money but by who they spend time with on a day to day basis and what their worldviews are? Using openalex, I secured known organizational affiliations for all the scientists in the dataset.
Scientists’ research interests. Openalex has this in structured format too!
Coercion
I’m going to assume this is not major issue here, though to the extent a scientist can be coerced, it would probably be through funding, and we already have that data described above.
Ego
Scientists’ H-indices.
Scientists’ publication counts.
Scientists’ citation counts.
Scientists’ rolling average citedness over the past few years.
Yup. Openalex has all that stuff.
summary_stats: {
    2yr_mean_citedness: 1.5295340589458237,
    h_index: 45,
    i10_index: 205
}
The Rogue’s Gallery
The section above characterizes the X, the independent variables, the features. This section will characterize the Y’s, the dependent variable, the target. When has a scientist behaved poorly?
Any measure of this is going to have to be binary, and it’s going to have to be subjective. Some ways of doing it are more subjective than others. I’ve elected to allow two separate specifications: a completely subjective way and a semi-subjective way.
The Completely Subjective Way
I’ve coded this in the data as “rba_censure”. This is when I personally think a scientist has behaved badly on this subject.
Over the past five years, if a scientist has been an author on a relevant publication they did not believe the conclusions of, they’re a rogue.
Over the past five years, if a scientist has publicly demonstrated material intellectual dishonesty on the origin subject, they’re a rogue.
Over the past five years, if a scientist has demonstrated deceptive or self-serving behavior on this subject, they’re a rogue.
Over the past five years, if a scientist has harassed or maliciously treated other investigators who are acting in good faith on this subject, they’re a rogue.
Yes, even the esteemed Mr. Baric is a rogue in this definition.
The Semi-Subjective Way
I’ve coded this in the data as “unsound_publications”.
If a scientist is a named author on one or more of three flimsy publications, two of which have known technical issues and errata, such as Crits-Christoph et al., 2024, Pekar et al., 2022, or Worobey et al., 2022, and they’ve shown no contrition or self-reflection about it, they’re a rogue and they’re going on the shit list.
Lest I be accused of stacking the deck and creating the data around a single cohort of scientists, well, you’ll have to take my word that I didn’t. The list of 243 was mostly programmatically assembled in advance of how people were classified, less than 10% of the 243 were subject to “rba_censure” as described above and only 12% had co-authored “unsound_publications”. Virology is not a large field, but I’m sorry to say you’ve had to work hard to get on one of these lists.
I’ve published a raw-ish version of the assembled data as a google sheet here. Please use it responsibly.
The Model
Now that we have X and Y, we can do standard, vanilla supervised learning. At the outset, I’m plainly going to state that modeling like this makes no assumptions or requirements about causation between X and Y. There’s an entire subfield called causal machine learning where such considerations do come into play, but we’re not doing that here. This type of model is only accounting for statistical associations between the aforementioned professional information about a scientist and whether they’ve made their way into the rogue’s gallery.
A lot of this data is very sparse, especially the institutional affiliations and the funding data to a lesser extent. Given this sparsity, I decided to use ElasticNet, which is basically just a generalized linear model with a twist. As I said before, virology is a small field and 243 scientists is typically fewer than you might expect from text book machine learning problems with sparse preprocessed data like this.
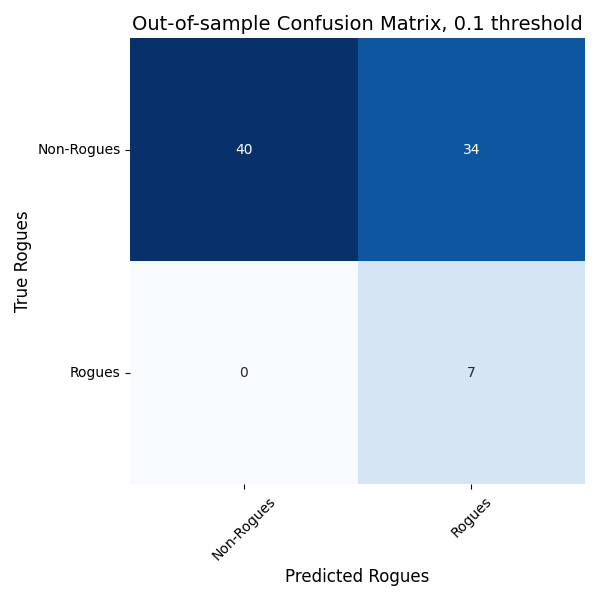
Is this model any good? That’s measured by its out-of-sample predictive validity: on data its not observed during training, is it any good at picking out the rogues? This is usually quantified in terms of true/false positives and true/false negatives. Here’s the out-of-sample confusion matrix for the “unsound_publications” ElasticNet model. The “rba_censure” model looks pretty similar.
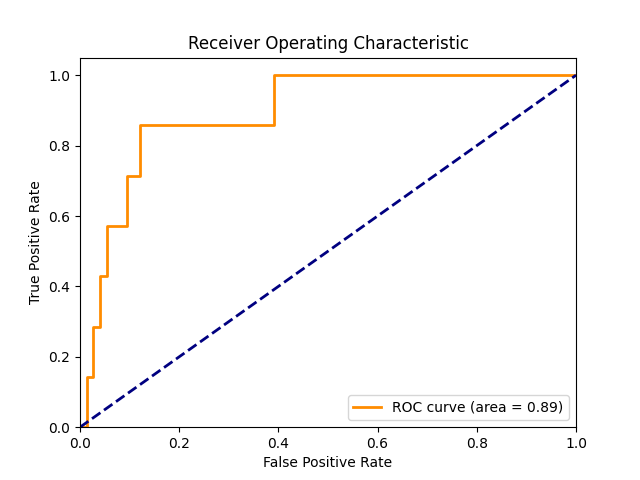
And here’s the corresponding ROC curve.
In Figure 1, the bigger the numbers on the diagonal are the more predictive the model is—the more true positives and true negatives the model predicted. In Figure 2, the higher and further to the left the orange curve is, the more predictive the model is. So there’s definitely some there there. The model is predictive of bad virologist behavior.
Robustness is our policy here, so lest you think I just picked a model with the best looking confusion matrix and ROC curve, the figures above were the first ones I created. Below are 3 different models trained with 3 different data splitting seeds.


and their corresponding ROC curves.


Great. So the model can identify bad behavior for virologists from looking at some combination of their citation statistics, funding, and affiliations but for an individual virologist, can we see why the model thinks they’re behaving badly?
Shapley values
Shapley values were invented in the 1950s to answer a question in game theory: If a group of people are working together to some end, how should credit being fairly divided among them, where the definition of “fairness” has some formal properties. Lloyd Shapley nailed this problem on his way to a Nobel prize for something else, and 50 years later someone figured out this idea had applications in machine learning. If a group of independent variables are contributing to making a prediction about something, how should credit be fairly divided among them? In answering this question, you’re simultaneously answering which variables are the most important to a predictive model.
In supervised machine learning, a set of Shapley values are numbers, one per variable that the model depends on, which add up to the model’s prediction, which in our case is the probability of a virologist behaving badly.
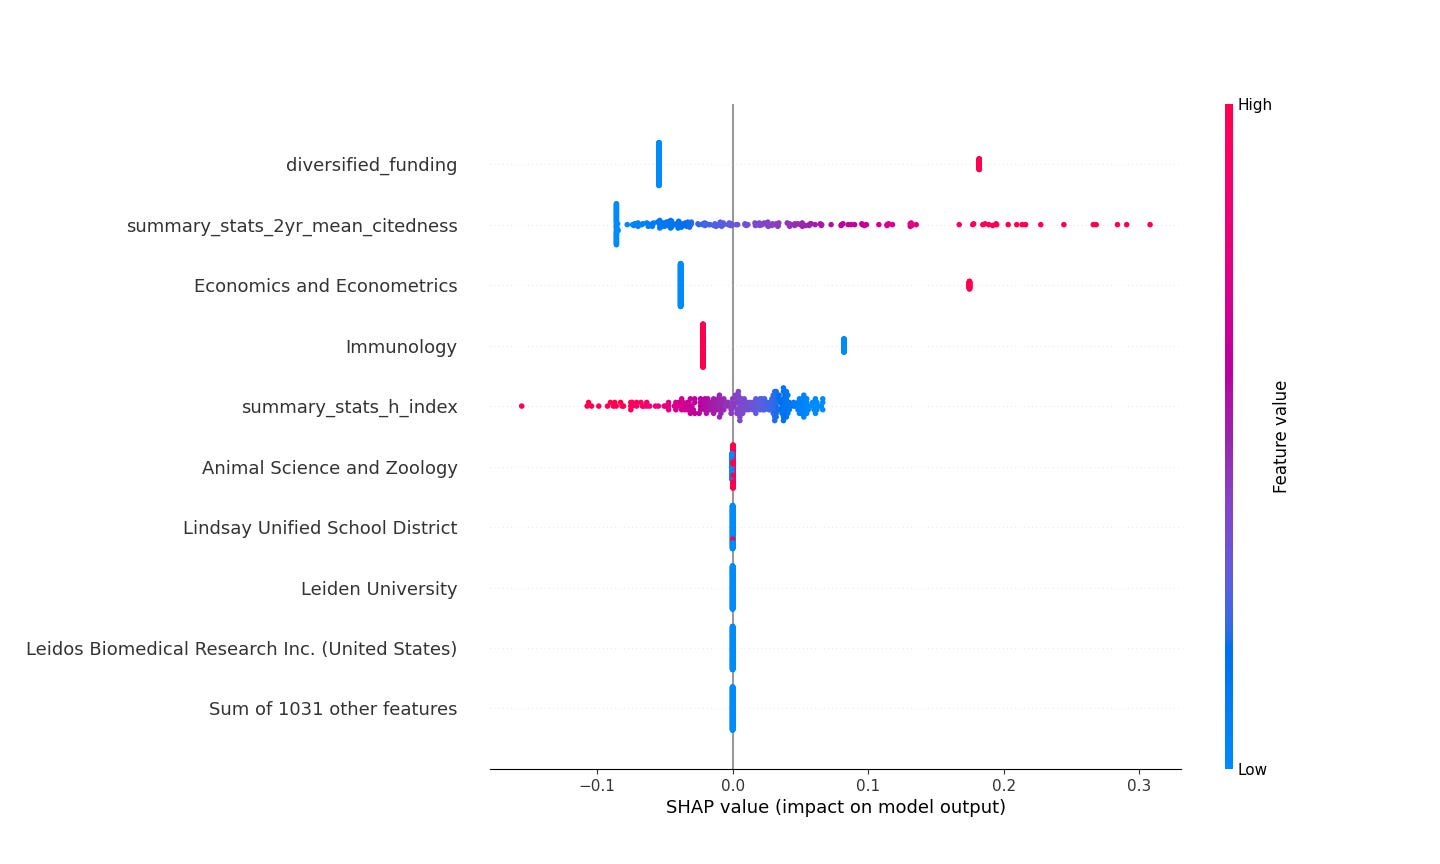
Shapley values have become a workhorse in machine learning interpretability, and Scott Lundberg’s SHAP library is a mainstay for practitioners. Here’s a “beeswarm” plot of the SHAP values for the “rba_censure” ElasticNet model. It’s a little weird to look at for the first time, so we’re going to break it down.
This plot describes the global importance of each variable the model uses. Each scientist is a dot in this plot. The red/blue gradient characterizes high versus low values for the variable in question. The SHAP values are on the x-axis; the further right or left the dot is for a given variable, the more extreme its SHAP value is and the more the model’s prediction is influenced by that variable.
Three main human readable takeaways from this plot are things like this.
A low citation count makes a virologist less likely to be a rogue and high citation counts make them more likely.
A low H-index makes a virologist more likely to be a rogue and a high H-index makes a virologist less likely.
Virologists with interests in modeling and simulation, economics and econometrics are more likely to be rogues and those without such interests are less likely.
Maybe I buried the lead here. Look at the last row of figure 5! None of the funding or affiliation variables have any large net impact—it’s only the research interests and citation stuff that really matters. For all of the enormous amount of ink that’s been spilled and all the Twitter vitriol let loose, it’s not particular funding sources that seems to determine the behavior of these scientists. Here, it looks like they’re a scientific clique interested in using bullshit modeling and simulations to “prove” how diseases emerge. Given the importance of citations you can see in the visualization, it’s apparent you can hang up a shingle, make some KDE plots or run some simulations, and make a damn fine living.
So the rogues tend to be quantitative parvenus who have accumulated a bunch of citations doing fancy modeling and sim work, but have comparatively low influence in the form of H-indices. This picture is starting to come together now…
The “unsound_publications” model tells a similar but slightly different story.
Whether a scientist has diversified funding shows significant influence in the models’ decisions, but the red values on the right indicate it’s established scientists with well-diversified funding who are more likely to publish bullshit, not scientists with less diversified funding.
I’m not claiming here that the funding or the affiliation data doesn’t have anything to say about individual scientists here. As you will see below, that’s not actually true, and it often does. I’m claiming that looking at the model’s properties over the entire dataset, that information isn’t that important. To demonstrate this directly, I retrained the ElasticNet model without any of the institutional or funding variables. The ROC curve is mostly intact even when the model doesn’t know about that stuff. See figure 7.

Naming names
Now for the crescendo. SHAP values are at the row level, so we can get prediction explanations for each virologist in the dataset, and even those outside of it if the data can be procured; these row-level values can be aggregated as in the plots above in Figures 5 and 6.
I’m not going to name names here, but if there’s interest in looking at the row-level explanations, I’ve created and deployed a simple application here where you can toggle or search through the virologists in the dataset, see how roguish the two different models think they are, and see the explanations for why the models think the way they do. Here’s an example of what the application looks like.
Coda
This idea could definitely be improved upon as a way to study scientists’ motives. Ideally, the dataset would be expanded and more rigorously checked for quality. Different sources of data could also be incorporated. In a different life, I worked developing graph-theoretic features used to find fraud in payments networks and here I considered using co-publication information across a literature to create an authorship graph that could be exploited. It turned out to be a little more work than I bargained for, is definitely feasible, but will have to wait.
Overall, this paints a more flattering picture of these scientists than I expected, and probably more flattering than they deserve. In the MICE framework, at least in this model specification, there’s little evidence of some of sort of concentrated funding capture, and variables in the model doing the heavy lifting aren’t the monetary ones. Most of the bad apples seem to be working from a place of prestige career building (Ego) and potentially flawed ideas about the nature of zoonotic spillover (Ideology).


