
Playing Possum: The Variability Hypothesis
A test of the greater male variability hypothesis, from down under.

A long time ago in a galaxy far, far away, before #MeToo and Harvey Weinstein, before misinformation and disinformation, Larry Summers got fired.
He was the president of Harvard, and had the temerity to suggest maybe men were different from women, at least in a distributional sense.
“There is relatively clear evidence that whatever the difference in means—which can be debated—there is a difference in the standard deviation and variability of a male and female population,”
Summers is referencing research suggesting that across different traits, men might have more extreme outcomes than women. Men are more likely to end up in the C-suite, and in jail, than women. They are more likely to have ten children, and zero children, than women. Summers was using what’s now apparently become known on wikipedia as the variability hypothesis to explain why women were less likely to occupy elite academic positions than men were.
Even by the practically Victorian lights of 2005, this was enough to get Summers canned from his perch at the top of Harvard. But Elon’s bought twitter, there’s been a vibeshift, and since 2005 2022, you can once again discuss such things.
Here at RBA at law, we don’t care about trivia like whether the greater male variability hypothesis is true. We’re digging deeper; we want to answer the bigger question of why it’s true, or at least identify the flawed arguments for why it’s true. Darwin himself noted
The cause of the greater general variability in the male sex, than in the female is unknown.
The Inquisitive Bird has also looked into this if you want more background on the facts of the case; regarding the cause, there are different theories.
X-inactivation
Everyone knows that human males and females have different karyotypes. Males are XY and females are XX. Males get (mostly) their mother’s X chromosome, and females get two X’s. As far as I know, this is true for all placental mammals.
Fewer people know that such mammals have a complicated system to “deactivate” expression of both X chromosomes in females. In any single somatic female cell, only a single X chromosome is expressed at random out of the two she’s inherited. If this doesn’t happen, a female might get a double dose of X-linked gene products, which is biologically problematic.
Given this reality, in tissues where X-linked genes are expressed, which is practically all of them, the female’s phenotype is averaged over both possible X-linked gene products, and the male’s phenotype is not. This averaging over X-linked genes (maybe 6% of her genome) could decrease her phenotypic variability in comparison to the unaveraged male genome.
G’day
Marsupials are mammals mostly living in Australia or near there. Possums are marsupials that exist in the new world, but they also exist in Australia. Tasmanian devils are marsupials that live in Tasmania. Everyone knows that marsupials have pouches; fewer people know female marsupials don’t have the same X-inactivation process as placental mammals. In marsupials, only the mother’s X chromosome remains active in somatic cells. As a result, there is no X-linked phenotypical averaging that would differentiate males and female trait variance, and we have a test of whether the variability hypothesis is explained by X-inactivation. If it is, larger male variance would not be observed in marsupial traits.

We need to look at trait variance by biological sex in marsupials. Has anyone done this before?
I don’t think so. If they have, I haven’t found it. Bless their hearts, lots of people collect, well, niche datasets that I don’t have to assemble myself. Tasmanian devils are cute, charismatic, endangered, and suffer from a bizarre and fascinating type of infectious cancer. As a result, I was able to find a longitudinal dataset from Attard et al. which tracked, and I swear I am not making this up, Tasmanian devil whisker lengths over more than 600 individuals. The data and code for this analysis is checked in here.
Tasmanian devils
The convention here is to put the male/female mean differences in terms of Cohen’s d effect size since most of the human traits under discussion are normally distributed. As you can see below in Figure 1, Tasmanian devil whisker length is not normally distributed, but I still think it’s kosher to use it on these distributions. The male-female Cohen-d for this dataset is 0.066; this is tiny, implying that males and females have whisker lengths with comparable means.

The variance ratio for these distributions is 1.36 which is moderately larger than what’s been measured in some human traits. This variability ratio just means the male variance over the female variance.
Possums
A single weird trait in a single marsupial? What does this prove, RBA? Fair. We emphasize analysis robustness here. In an astonishing stroke of luck, there’s a morphological dataset of 104 possums captured in Australia that’s part of the fairly standard DAAG package in R.
library(DAAG)

data(possum)

head(possum)

    case site Pop sex age hdlngth skullw totlngth taill footlgth earconch  eye
C3     1    1 Vic   m   8    94.1   60.4     89.0  36.0     74.5     54.5 15.2
C5     2    1 Vic   f   6    92.5   57.6     91.5  36.5     72.5     51.2 16.0
C10    3    1 Vic   f   6    94.0   60.0     95.5  39.0     75.4     51.9 15.5
C15    4    1 Vic   f   6    93.2   57.1     92.0  38.0     76.1     52.2 15.2
C23    5    1 Vic   f   2    91.5   56.3     85.5  36.0     71.0     53.2 15.1
C24    6    1 Vic   f   1    93.1   54.8     90.5  35.5     73.2     53.6 14.2
    chest belly
C3   28.0    36
C5   28.5    33
C10  30.0    34
C15  28.0    34
C23  28.5    33
C24  30.0    32
>
The Inquisitive Bird notes that in human datasets there are often correlations between effect sizes between men and women and the associated variability ratios. In other words, traits with greater mean male-female differences will tend to have high male variability.

Do the possums’ morphological subtests look the same?
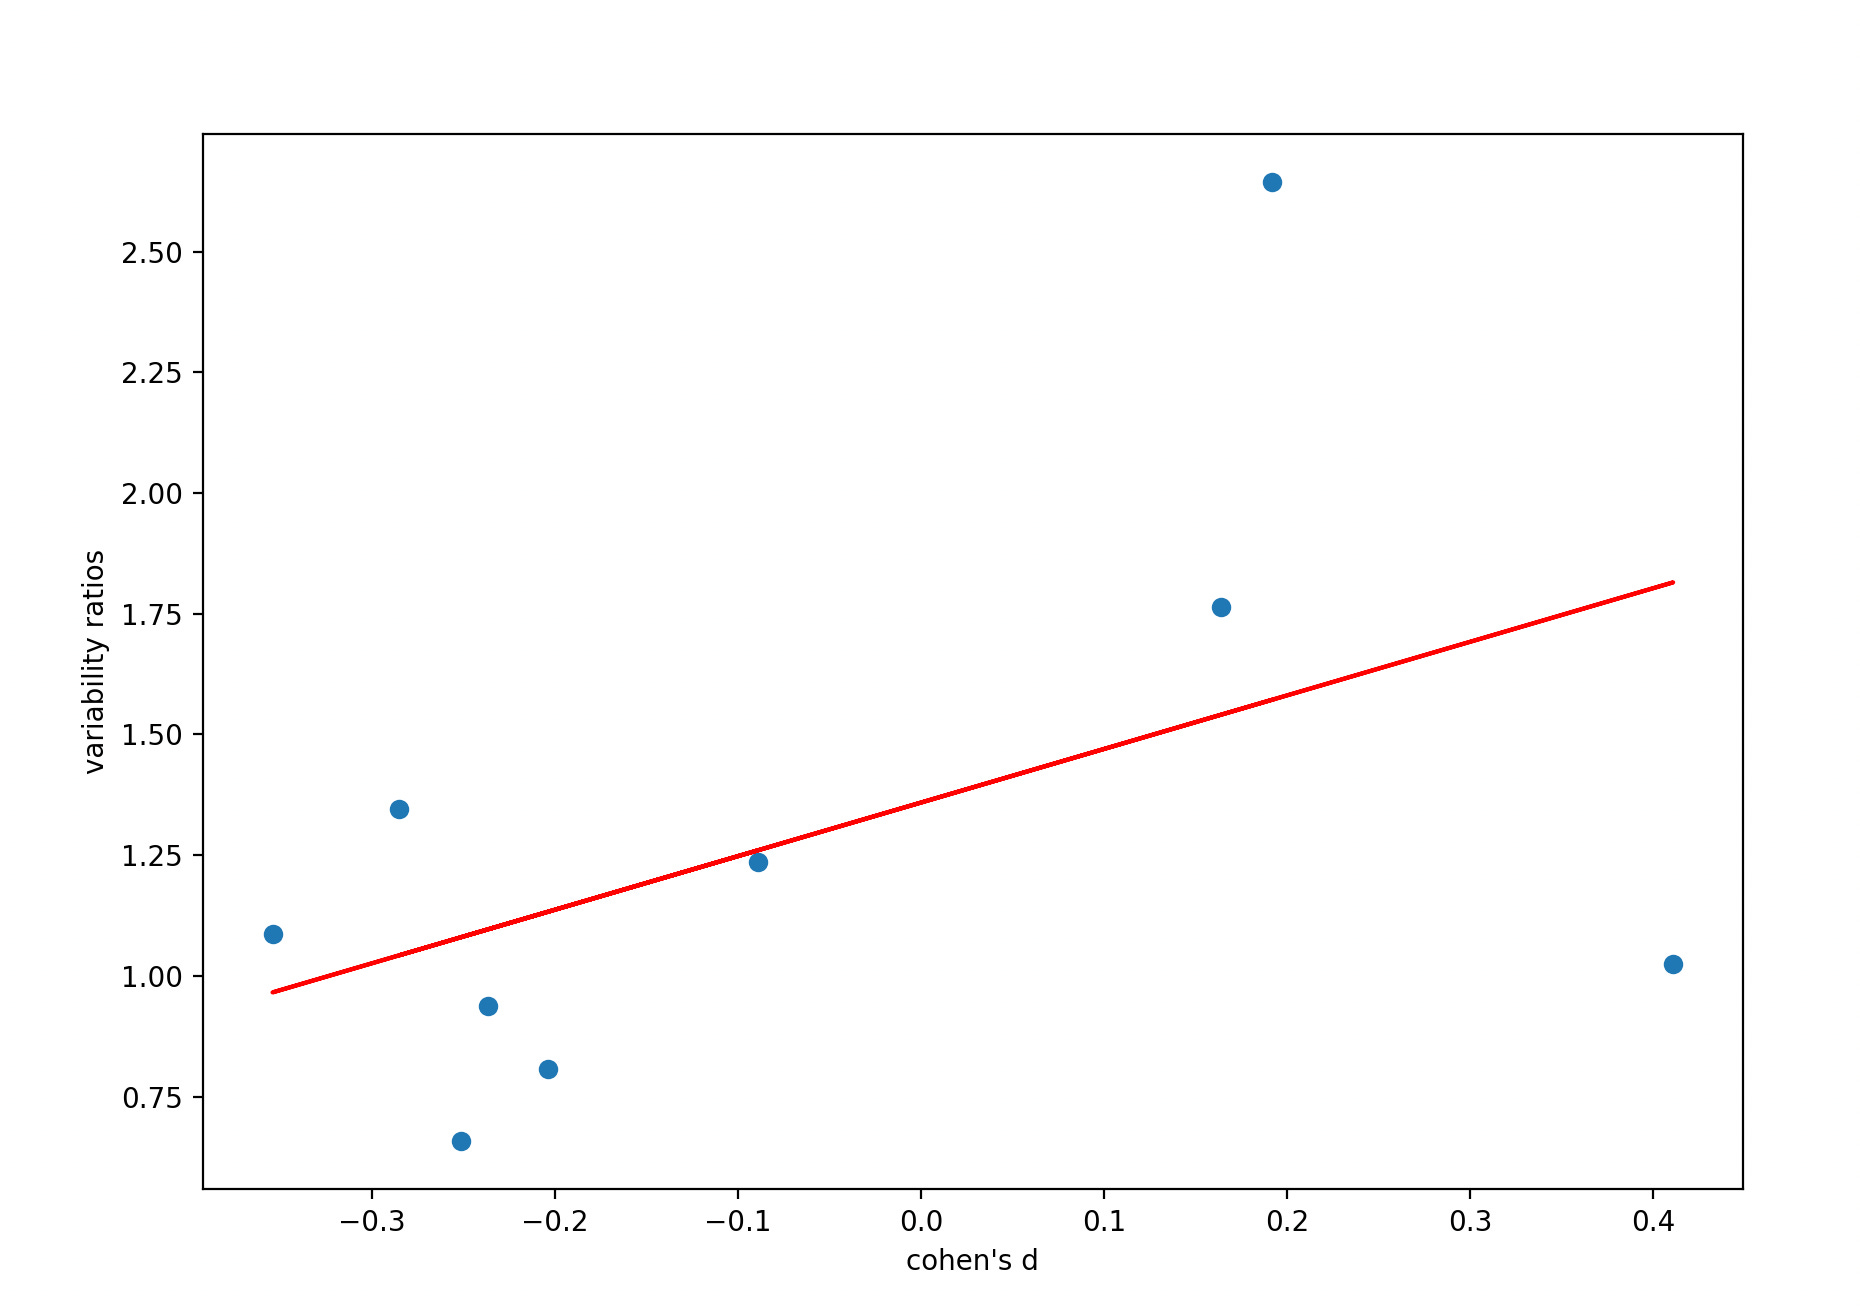
Yes. There are fewer tests obviously, but in fact, at d = 0, the best fit line predicts a variability ratio of 1.36, exactly consistent with the Tasmanian devils’ dataset. The result is non-significant with so few tests. Measure your possums better!
Conclusion
In different datasets describing different species’ morphologies, this analysis shows that greater male variability exists in marsupials. In fact, the observed variability ratios exceed those in some data gathered from placental mammals, including humans. This suggests that the variability hypothesis cannot be explained by the X-inactivation mechanism that governs placental mammal phenotypes.
What are some alternative explanations we should look at instead?
Stabilizing selection
A casual observer might have noticed that human female reproduction is fraught. In order to get a healthy child, over nine months, everything has to go right over what have been unpredictable and dangerous evolutionary times. From the cellular level where chromosomes segregate (and stay perfect and inert for decades!) at the beginning to the finished-baby level at the end, the female body performs a stunning feat of biological engineering. She has incubated a perfect, tiny, helpless person within her. This feat is a comprised of a diverse set of biological tasks, running through hundreds of biological pathways, governed by thousands of genes.
The same casual observer will note that human male reproduction is … less fraught. It can turn over in under an hour, and maybe faster if you’ve got gatorade handy. This is true regardless of where you live in the mammalian class of the animal kingdom.
Stabilizing selection is the sort of natural selection that penalizes outlying phenotypes. If you’re too tall or too short, too fat or too skinny, too smart or too dumb, or simply too weird, Darwin won’t smile upon you and you won’t reproduce. By this type of selection, the average is privileged.
In this explanation of the variability hypothesis, males express greater phenotypic variability because female reproduction is unforgiving, and males don’t have to do it. Females experience greater stabilizing selection than males across traits sharing pathways with exacting female child-bearing. This can also explain the enormous diversity of traits that apparently shows greater male variability.
In many evolutionary stories, there’s some indirect causal route from a trait being selected to evolutionary fitness. The stabilizing selection explanation of the variability hypothesis is appealing because the trait being selected isn’t eye color, skin tone, or playfulness, or whatever; the trait is literally the ability to carry a child to term, one of the most direct measures of female fitness.
Any test of this is indirect and difficult; you might look at male/female variability ratios in mammals having long pregnancies versus those having short ones—longer ones would predict more female stabilizing selection and higher variability ratios. You also could look at variability ratios in species where male and female reproductive roles are sort of swapped, like seahorses or something. Maybe we’ll do this in another poast.
Math dorks out of control
I’m only adding this because it has some interesting intrigue. In 2017, Hill et al. published a paper proposing a mathematically sophisticated evolutionary explanation for the variability hypothesis. It was published, and taken down from that journal. And published again in another journal, and taken down again. A 2020 published version of this exists here in Journal of Interdisciplinary Mathematics, and apparently a preprint went up a few months ago?
Like, I said, intrigue. Hill’s idea is based off sexual selection; his argument is that the variability hypothesis can be explained by female choosiness and threshold effects in mating. Tim Gowers, who speaks to God himself, panned the paper, and I don’t think it represents the facts of sexual selection very well, but it’s reasonable to entertain the idea that sexual selection has something to do with this. Maybe someone can develop this idea a little bit better, and hopefully empirically justify it as well.
As a math dork, I love first principles thinking, but we can get definitely get out of control without actual data underwriting our conclusions.

Great piece. Let me quickly get out over my skis.
It seems to me there are two types of explanations for IMVH—genetic-up and behavioral-down.
A fellow “math dork”, I’m inclined toward the behavioral-down explanation on the basis of theory. In light of female selection. The fundamental male problem is to stand out. To stand out, be exceptional, literally.
Use your resources and cultivate your talents to venture out beyond the convex hull of other men.
Why not compete more directly? You could, but you would likely lose, playing someone else’s game. Your niche is a new point on the boundary of the growing star.
Why the *genetic* increased variability, then? Survival bias? As many points as the star may permit, there are still more interior men. Poor chaps who set out in one direction or another and were not to finish the journey. Some are chosen anyway, fewer than on the boundary. You were propelled, in part, to your success by some uncommon sauce, some slight advantage in the race to your corner of the map.
A just so story? Perhaps. Perhaps more?
Nice article!
On Summers- he was also in trouble for screwing up investments badly, connections with some unsavory Russian characters, etc. His remarks on M/F differences were peculiar because they focused on different abilities and different willingness to be obsessed with a career. Based on doctors, lawyers, etc. the career differences can't be an enormous factor in the different fractions in CS, physics, etc.. Different abilities also don't show up much in objective measures. He oddly skipped different interests, the factor that stands out most in objective measures and in anecdotes.