Update: The next 9 ways of looking at a data breach are now published here.
The data breach at NYU is one of the most revealing leaks in higher education history. The copy of the data I was able to procure has the personally identifiable information (PII) redacted, though it does contain a stunning amount of information that academic officers use in admissions decisions at NYU. Applicants’ parents’ occupations, their geography by country and by state, where they went to school, school type, where their siblings go to school, what extracurricular activities they did, ethnic and racial identification, whether they need financial aid, intended majors, SAT and ACT scores, GPA data, and on and on.
For an interesting comparison, consider the expert testimony in the landmark case Students for Fair Admissions v. Harvard. In his valiant attempting to prove that when you control for all the racism, Harvard’s admission’s process isn’t racist, David Card’s report contains a regression model with 16 different “base control” variables, to say nothing of the dozens more non-base control variables. I was only able to find a handful of data elements that Card used that *weren’t* in the NYU data breach, and that might only be because the they’re hard to find. The common application table alone has almost 800 separate fields. Card’s data only went back to 2014. Some of the data from NYU goes back years further.
Harvard gave their $750 an hour, Nobel Prize winning expert consultant all the information they could to try to torpedo the plaintiff’s case, and there’s not much in there you can’t find in this NYU data excerpt.
On with it. We’ll eventually be looking at thirteen ways of looking at a data breach, but what are the first four?
I. Admission rates over time
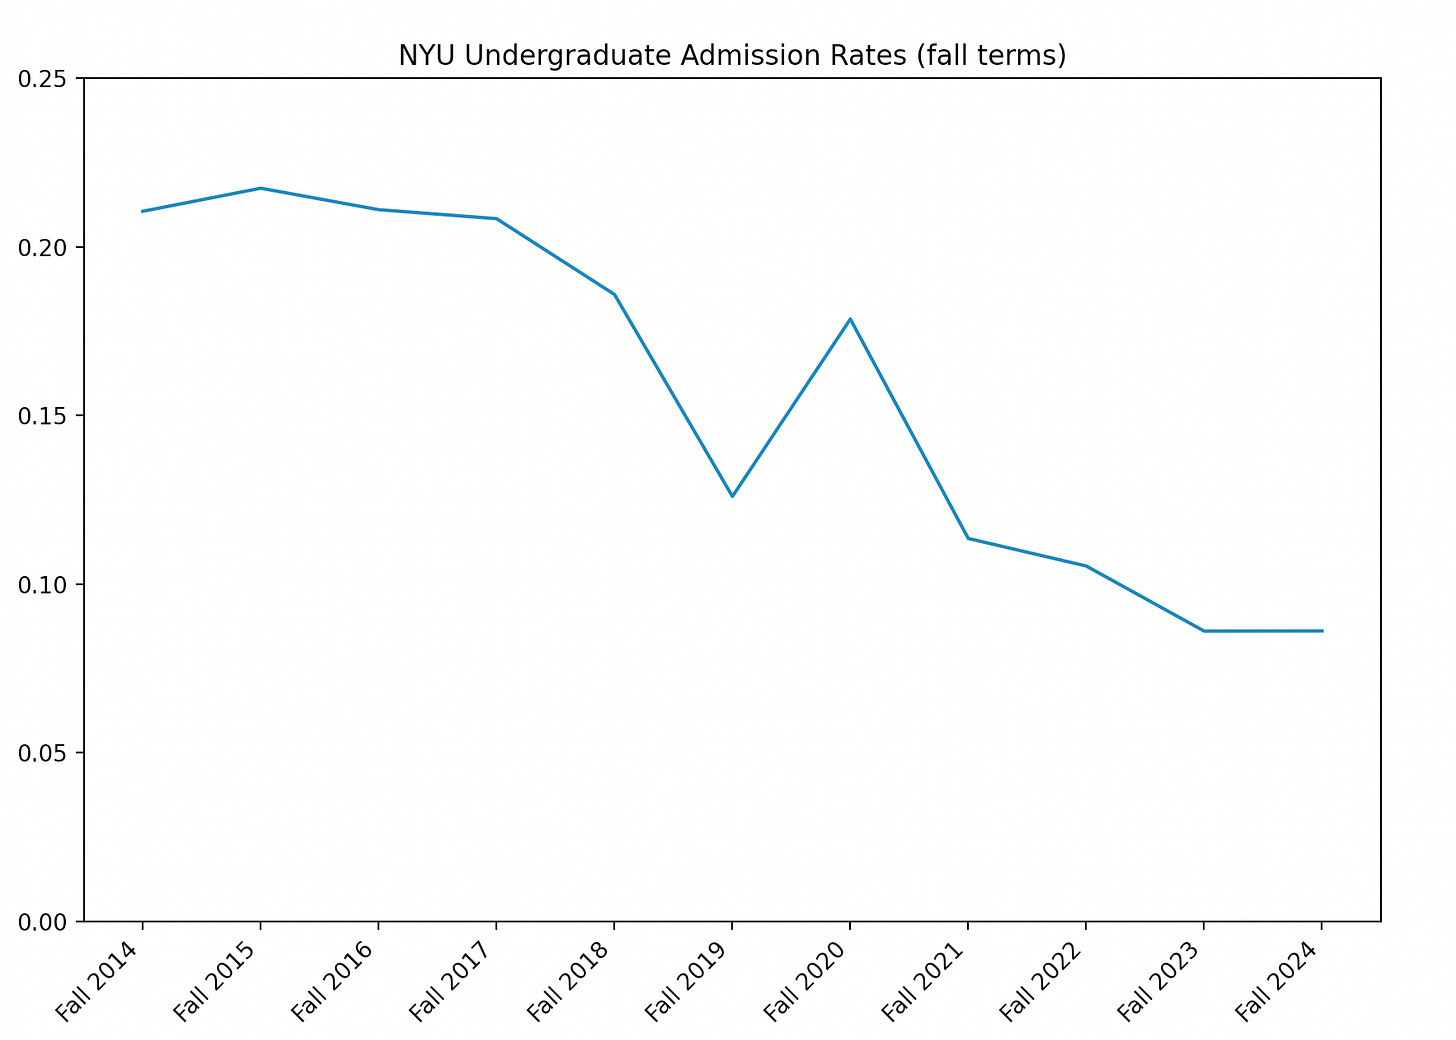
I’ve always wondered about this, so let’s warm up here. NYU has a bit of a reputation as a richie-rich, striving school with an inferiority complex. Schools like this perhaps go through different shenanigans to increase the denominator or decrease the numerator of their admission rates statistics in the effort to look more selective. The headline NYU admission rate for the class of 2028 was 8%. How has this rate changed over time?
The NYU leaked data puts the class of 2028 admission rate at 8.6% versus the headline 8%, but the most interesting thing happens in 2020 where the rate violently bucks the historical trend downward.
This makes sense. Why would you shell out fifty grand for your kid to do remote learning during a pandemic? The total applications dropped and the school probably had to admit more given the long term uncertainty the pandemic induced. The question is how does this square with the headline figures like this one
which shows a smooth, elegant decline in the acceptance rate even through the pandemic? I tried several different methodologies for calculating the admission rate from the leaked data, but none of them could account for or eliminate the acceptance spike in 2020 while maintaining the ~8% acceptance rate in 2024.
Given how plausible a spike in the acceptance rate would be from first principles, I’m inclined to trust the leaked data over the public figures.
II. SAT score replication
The bar plot with which the hacker, who goes by the handle “bestniggy”, chose to replace the NYU landing page was this one.
I attempted to replicate this finding and came up with Figure 4.
I don’t necessarily agree with the intended implications of Mr. Niggy’s plot, but I’m going to conclude this section early.
III. Parental occupations
I was a bit hesitant to include this section because it seems a little unfair. However, the major reason it seems unfair is how shocking I found it. I broke the last 10 years of undergraduate applications into matriculating applications and denied applications and plotted the word clouds of their parents’ occupations side by side.
How is this even possible? I can’t imagine there are enough Movers, Shakers, or Robber Barons in the entire country to inflate these tokens in this way. I guess you can tell who the matriculants are because “CEO” is a little larger in the cloud on the right. Is NYU basically just a finishing school for everyone in the tri-state area who thinks The Hunger Games is a how-to manual?
IV. Who gets reconsidered?
There’s an extremely rare admission status in this data called “Reconsideration” whereby I suppose a candidate’s qualifications are re-evaluated and their status reconsidered. Out of the millions of common applications over the past 10 years, only 3 have this status. I’m not going to tell you anything about them apart from the fact that they’re quite obviously not the sons of Hollywood stars or foreign despots.
Given how rarely this happens I’m actually inclined to think this is a defect in the data schema they’ve used rather than a real categorical delineation. This data shows many hallmarks of being part of an old legacy system.
Coda
I’ll be looking more carefully at this, and sharing nine more ways of looking at a data breach soon. If you have specific questions you want answered feel free to ask.


